Using the load map
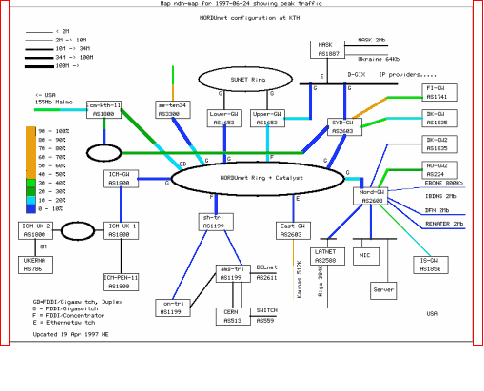
The graphical map can currently show the percentage load of the
circuits being monitored. A few extra points for explanation:
- Each link is drawn as two segments. The segment closest to a
given box (or shared medium) shows the value for the outgoing
traffic from that box or shared medium on that link.
- The areas closest to the link are normally "touch sensitive", in
that there is a reference to the corresponding plot for the
given port available there.
- The edges can be used to walk to the next and previous period,
as shown below:

he@nordu.net
Last modified: Wed Jun 25 23:31:37 MET DST 1997